Created on 2026-04-13 17:32
Published on 2026-04-14 14:30
TL;DR: 74% of FDA Complete Response Letters cite quality or manufacturing deficiencies. Manufacturing-category CRLs cause 30-35% single-day valuation declines and add a median of 1.28 years to approval timelines. And yet most boards govern clinical risk with quantitative models and CMC risk with a green status indicator. The companies that close that measurement gap make structurally different capital decisions. This article covers why the gap exists, what it costs, and what changes when boards start measuring both risk categories with the same rigor.
Pull up your board deck from last quarter.
How many slides are devoted to clinical risk? Probably a detailed section. Probability of technical success by indication. Enrollment projections modeled against multiple scenarios. Competitive landscape with risk tiers. Regulatory pathway mapped against precedent.
Now find the CMC section. How many slides? What level of analytical rigor sits behind those slides? Is there a green status indicator somewhere in there? And if there is, can anyone on the board explain exactly what it measures?
In most board decks I hear about, the clinical section runs ten to fifteen slides of structured analysis. The CMC section runs one to three slides of status updates. The ratio is not unusual. But the risk it implies is real.
Imagine you are trying to hit a target three years out. For one half of the risk, you have a laser sight. Calibrated optics. Adjustable for distance and conditions. For the other half, you are aiming by eye with a slingshot, adjusting by feel, and hoping the wind does not shift. Both halves determine whether you hit the target. But only one of them has an instrument behind it. That is roughly the state of how most biopharma boards govern clinical risk versus CMC risk today.
Most biopharma boards evaluate clinical risk using quantitative frameworks refined over decades. Probability of technical success. Phase transition rates. Historical base rates by therapeutic area and modality. Enrollment risk models. Endpoint sensitivity analysis. These tools are imperfect, but they give the board a structured way to debate assumptions, compare scenarios, and allocate capital against evidence. They are the laser sight.
CMC risk gets none of that. It gets narrative. "Process development is progressing." "Tech transfer is underway." "The CDMO relationship is strong." These updates are qualitative, often filtered through the CEO, and almost never presented with the kind of structured assumptions that would allow a board member to pressure-test them. This is aiming by eye.
The result is a governance asymmetry. One category of risk is debated with calibrated instruments. The other is accepted on trust. And the category accepted on trust turns out to be, by the FDA's own data, the one most likely to block approval.
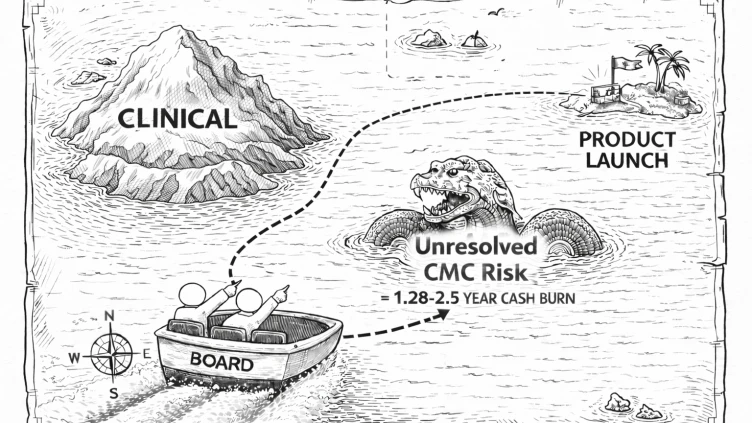
In a cross-sectional analysis of 43 novel therapeutics that received Complete Response Letters between 2020 and 2024, manufacturing facility deficiencies and CMC deficiencies were among the most commonly cited categories, with a median delay of 1.28 years from CRL to eventual approval. The FDA's July 2025 publication of 202 CRLs confirmed the pattern at scale: 74% cited quality or manufacturing deficiencies.
Three quarters of the approval-blocking events in the FDA's dataset originated in the risk category that most boards govern without an instrument.
This is not about negligence. It is a competency gap with structural roots.
Clinical development has been a board-level discipline for decades. Most biopharma directors have either run clinical programs, invested in them, or regulated them. They know the vocabulary, they recognize the signals, and they have developed instincts for when a clinical narrative is tracking reality versus when it is drifting. That experience took years to build, and the governance infrastructure around it is mature. The laser sight was built over time, by people who understood the target.
CMC and manufacturing operations have not had the same tenure at the board table. The recognition that technical operations requires unified, senior-level oversight with genuine authority only became widespread in the last ten years or so, driven largely by the complexity of cell and gene therapies and a wave of clinical-stage failures with manufacturing roots. Before that, the head of technical operations typically sat deep in the org chart, not at the board interface.
The consequence is that most boards are stocked with people who can interrogate a clinical probability model but would not know which questions to ask about comparability strategy, analytical method lifecycle, or CDMO capacity allocation. They are not ignoring CMC risk. They cannot see it in the form they receive it. And the executives presenting to the board are often not CMC experts themselves, which means the information gets simplified before it ever reaches the room.
The financial mechanics are concrete, and they play out in the same valuation models that boards already use for clinical risk.
Most acquirers and late-stage investors price biopharma assets using risk-adjusted net present value, where future cash flows are discounted by the probability of regulatory and commercial success at each development stage. Clinical risk and CMC risk both live inside that model, but they affect it through different mechanisms.
Clinical risk changes the probability numerator. A failed Phase 2 readout reduces the estimated likelihood of approval directly. The market has frameworks for pricing this, and it reprices quickly.
CMC risk changes the timeline denominator. A manufacturing-related CRL does not kill the asset. The science is usually intact. But it adds 1.28 years at the median, and 2.5 years for first-time launchers, to the path to approval. That extension compresses the NPV of the asset, increases the capital required to reach commercialization, and reprices the probability of approval from the 70-80% range down to 10-40% while the deficiency is unresolved. Companies that receive manufacturing-related CRLs typically see single-day valuation declines in the 30 to 35% range. The stock often recovers because the science survives, but the financing trajectory shifts.
In the current environment, those shifts compound. Crossover investors are scrutinizing CMC readiness before committing capital. Persistent CRL histories narrow the available investor universe. Deal structures shift toward tranched milestones, CVRs, and credit-like instruments rather than clean equity. Companies with unresolved manufacturing CRLs increasingly pursue strategic alternatives because the financing markets discount them prohibitively.
None of that shows up in a green status indicator. And none of it has to happen if the measurement gap gets closed early enough.
The boards that have figured this out do not just ask better questions. They apply a different standard of evidence to CMC risk entirely. They build the instrument.
They evaluate manufacturing assumptions with the same structured skepticism they bring to clinical assumptions. When the CTO presents a timeline, the board asks: on track relative to what baseline? What are the comparability requirements if the process changes between Phase 2 and Phase 3? What is the analytical method qualification timeline, and does it align with the filing strategy? What happens to the CDMO relationship if their capacity fills and your program drops in priority?
These are not adversarial questions. They are the manufacturing equivalent of the questions every board already asks about clinical enrollment, endpoint design, and regulatory pathway. The only difference is that most boards have never been equipped to ask them, and most board compositions do not include the people who instinctively would.
Companies that close this gap tend to make different capital allocation decisions. They invest in process characterization earlier because they understand that the upstream decisions define the ceiling at commercial scale. They treat CDMO governance as a board-level variable, not an operational report. They size quality and analytical capacity against surge demand during submission preparation, not against steady-state workload. And they bring someone into the boardroom who can read the manufacturing risk landscape with the same depth that the clinical directors bring to the science.
I have spent the past year working on a structured governance framework for exactly this problem, built in conversation with CTOs, board members, and investors who have been on both sides of the measurement gap. The framework gives boards a way to evaluate whether their technical leadership is aligned to the dominant risk at each stage of development, using the same kind of structured assumptions and stage-specific emphasis that clinical governance already provides.
May 14th will be the day that 10 years worth of conversations and 18 rounds of refinement is released.
In the meantime, if you see that you’ve got a 5:1 ratio (or more) in your board deck you have a risk measurement delta, and this raises two core questions: What will this gap cost your business? And more importantly, what could that gap cost your patients?
Closing that gap takes governance change and a leader with the knowledge to close it. Phase 3 Search is here to do both.
Every engagement begins with a diagnostic — a structured read on the role and the company you are actually inheriting.
Start a diagnostic